Simply put: Klages et al. (2020)
Paleoclimate science -- or the science of the climates of the past -- sometimes tells us truly confounding things about how the world was before we arrived on the scene. Here I describe (for the layman) the findings of a study by a group of paleoclimatologists who studied the climate of the Cretaceous Period. This post is based on the paper "Temperate rainforests near the South Pole during peak Cretaceous warmth" by Klages et al. (2020), published in Nature. As the title gives away, the mid-Cretaceous was so warm that there were rainforests near the South Pole! Now if I have your attention, let's explore.
Some context
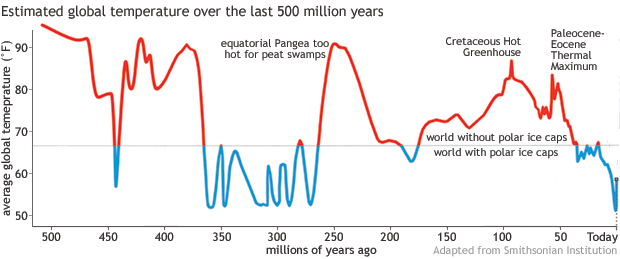
The Earth has seen several warm periods in its past. Take a look at how the global temperature is thought to have varied over the last 500 million years. (50 ℉ = 10 ℃. 90 ℉ = 32.2 ℃. No, I did not choose the scale for the y-axis.)
Note where the Cretaceous Hot Greenhouse is marked in the plot below. Klages et al. (2020) focused on the time period between 92-83 million years ago. On the Geological Time Scale, this falls under the Turonian-Santonian ages of the Cretaceous Period.
 | |||
| Source |
An etymological digression (Yes, already; because why not)
The Cretaceous was warm and sea levels were high. This meant a lot of what is land today was covered with inland seas back then. More seas means more calcium carbonate or "chalk" deposition. "Chalk" is creta in Latin, and that's where the Cretaceous got its name from. The Turonian and Santonian get their names from their type localities (the places where they were first identified), the cities of Tours and Saintonge in France.
The Cretaceous Hothouse
As you can imagine, the South Pole is super cold today. Mean annual temperature is around -50 ℃. Summer "high" temperatures are around -25 ℃. Compare this with the Cretaceous when, as the authors estimate, the mean annual temperature was around 13 ℃ and the summer "high" temperatures were around 18.5 ℃ near the South Pole! The global sea level back then is thought to be 170 m higher than present. This is what the world likely looked like (see the inland seas?):
 |
| Source |
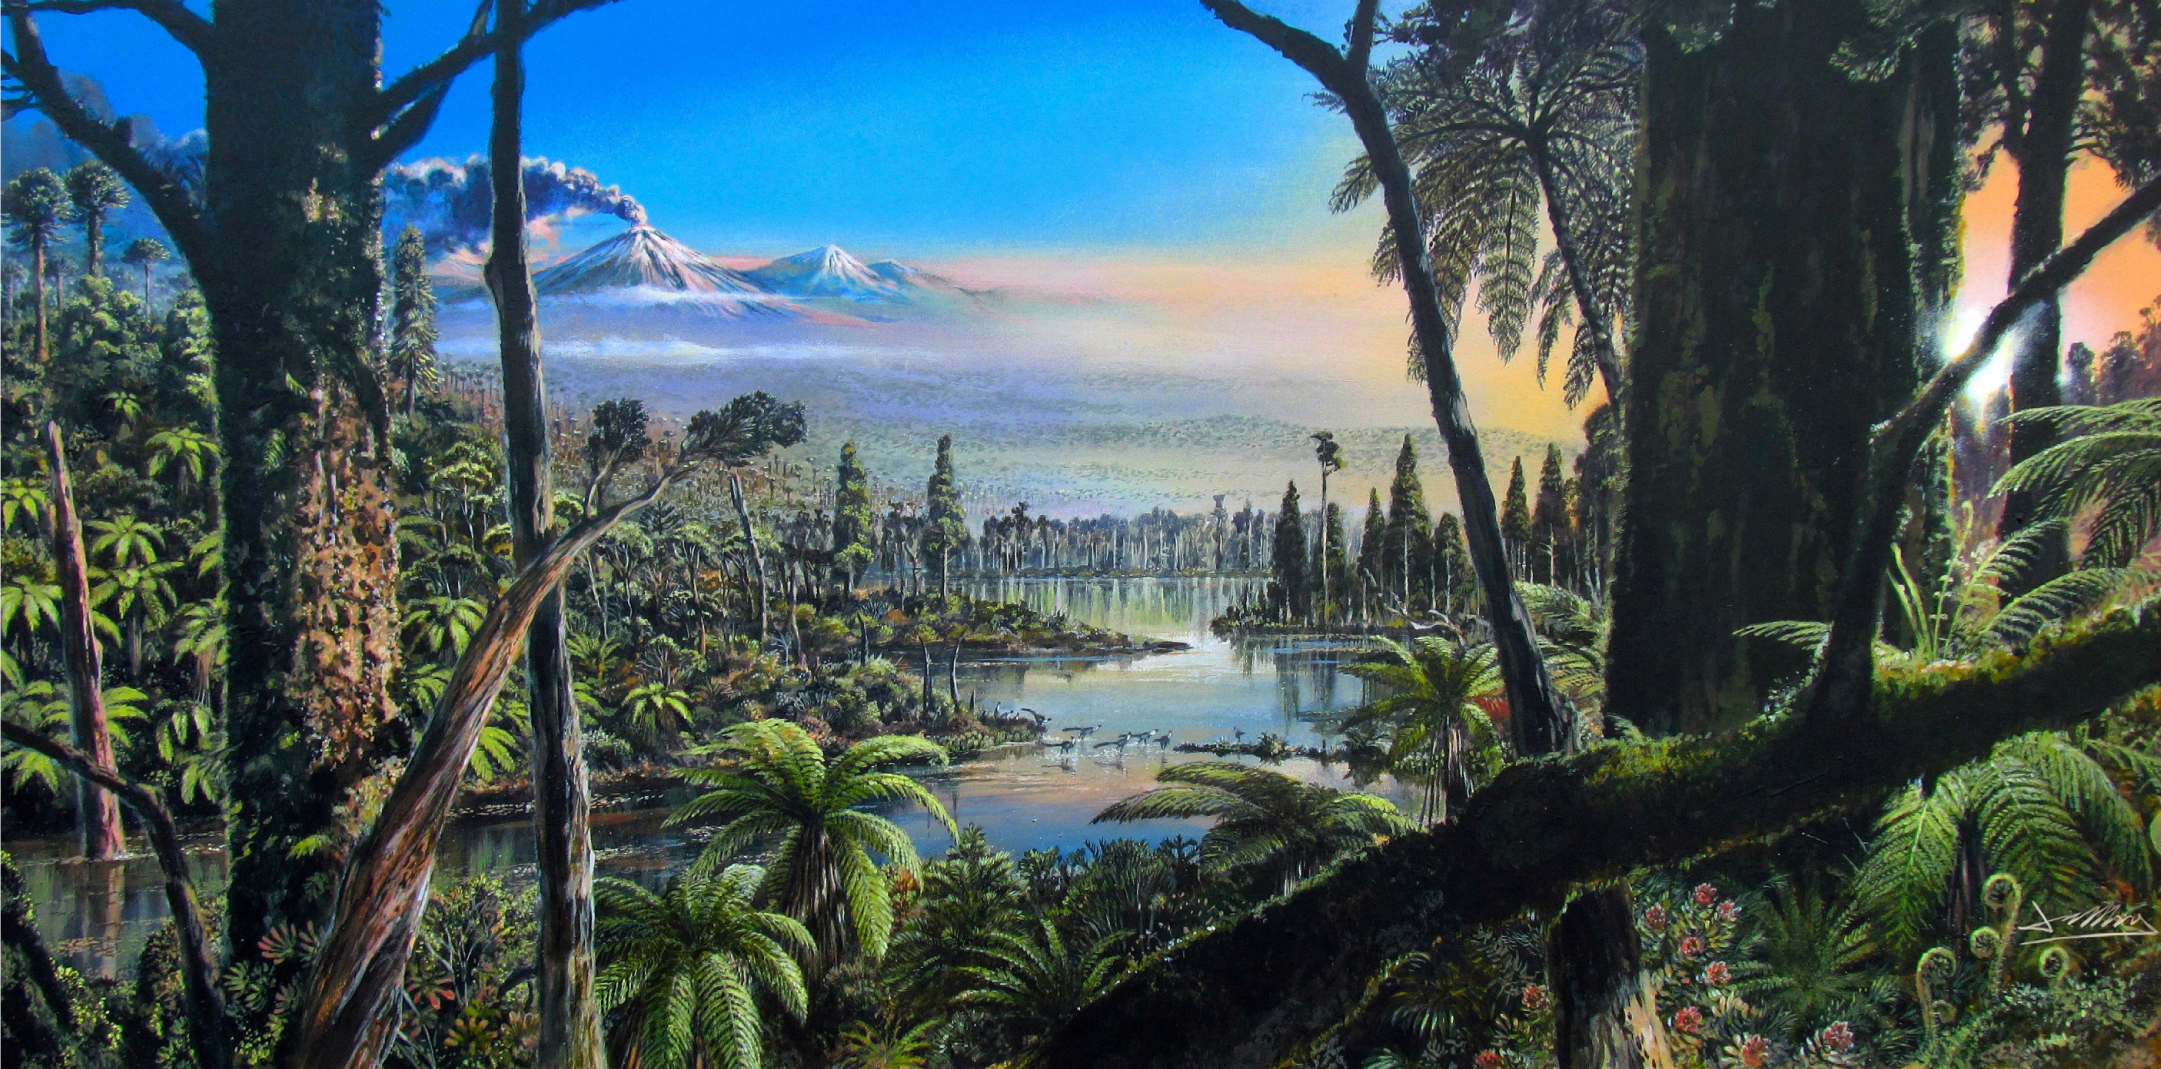
The results of this study are based on samples from West Antarctica. But since the continents had different positions back then, the authors first determined the paleogeographic position of their drilling site (~82 °S). Next, they collected paleontological, sedimentological, geochemical and mineralogical data to conclude that the samples were deposited in a swampy environment and a temperate climate back in the Cretaceous. The 'coolest' part is the presence of fossilized roots of what appear to be vascular plants. Combined with fossil pollen, the scientists could visualize the presence of conifer trees and flowering shrubs. All in all, the icy, frozen landscape of today's Antarctica looked like a temperate rainforest back in the Cretaceous:
 |
| Source |
Cretaceous CO2
If you know a thing or two about modern climate change, you've likely wondered about Cretaceous CO2 levels by now. A previous compilation placed them around 1000 ppm. (As I write this, the latest CO2 reading on the Keeling Curve sits at 423.49 ppm.) In this study, Klages et al. also used a climate model called COSMOS to run climate simulations with 1x, 2x, 4x and 6x of the CO2 levels of pre-industrial time (280 ppm). Thus, this corresponds to simulations with 280, 560, 1120 and 1680 ppm of CO2. The proxies had indicated summer temperatures around 19 ℃. The models could not reproduce this at levels lower than the 4x-6x CO2 simulations (much greater than 1000 ppm). However, this discrepancy is partly due to the fact that the simulations were run with fixed vegetation. The vegetation albedo feedback is quite well known by now. Basically, when temperatures rise and vegetation grows, it further traps heat and raises temperatures -- generating a positive-feedback loop. If models do not incorporate this feedback (and they generally have a problem doing this), they are bound to under-estimate warming.
Back to the future
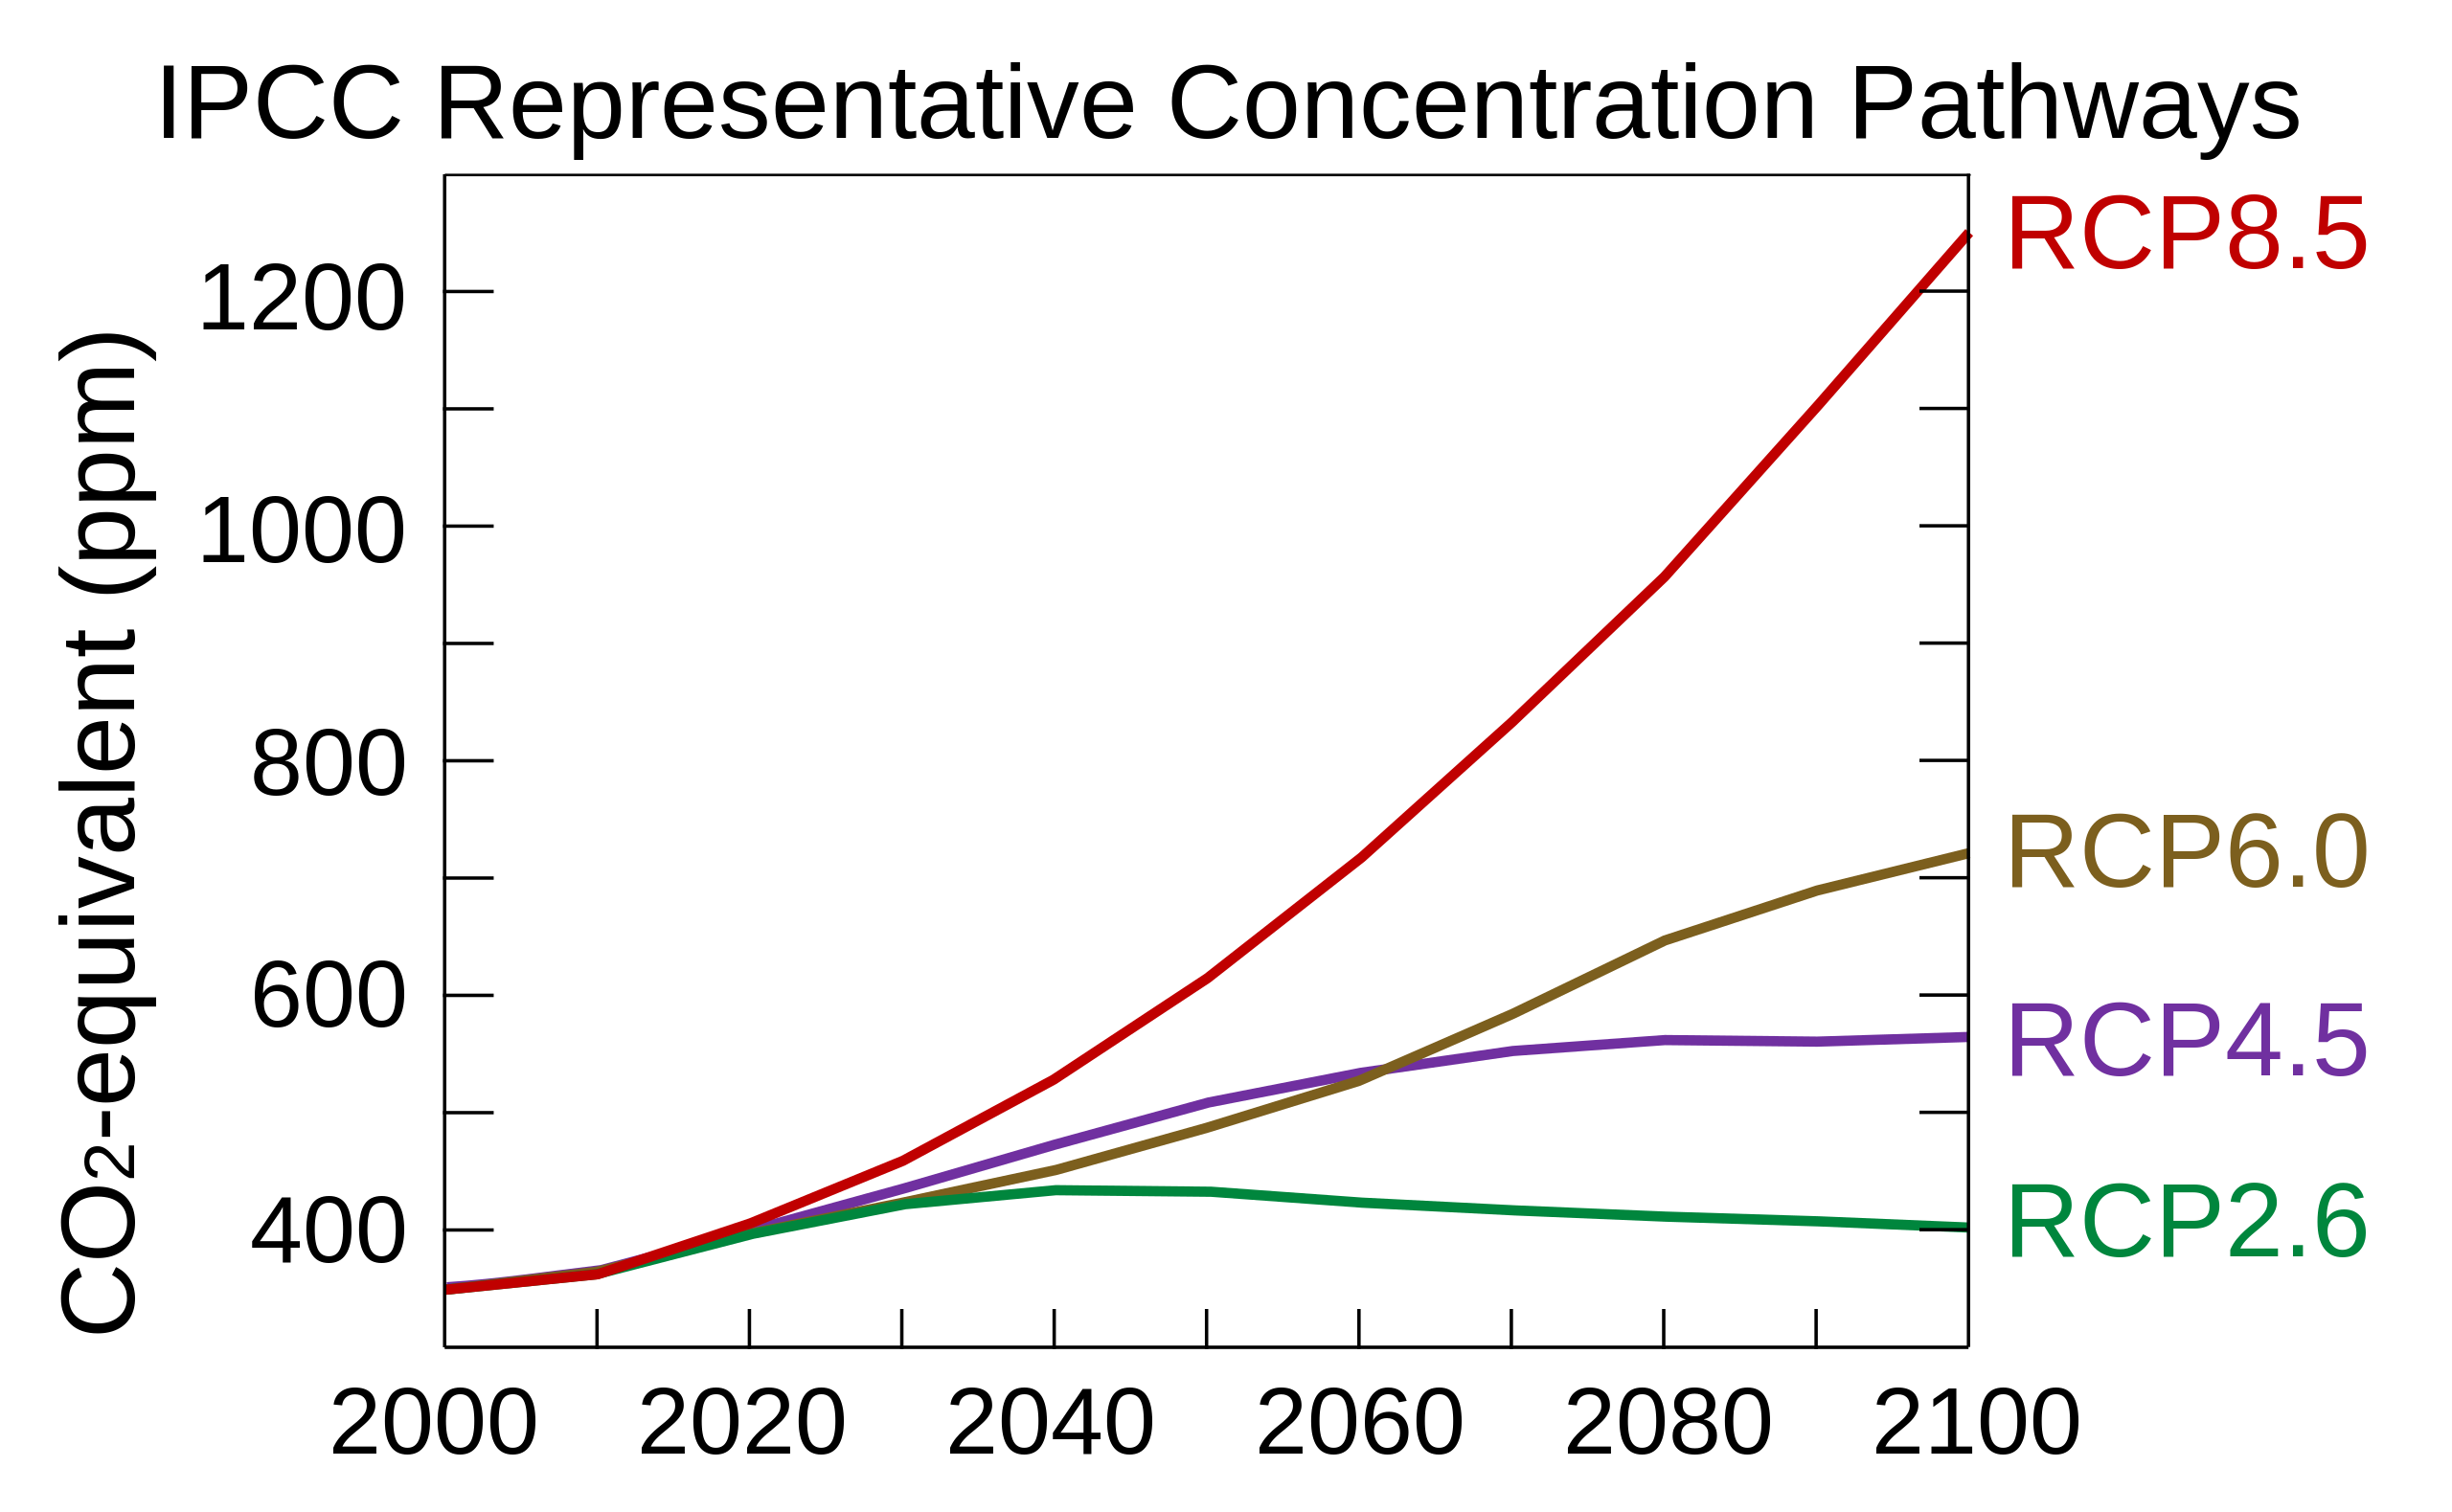
Will we hit 1000 ppm in our lifetimes? Naturally, climate models cannot answer that since there are no computationally solvable equations for human (ir)rationality yet. But climate models can project what would happen if we did hit 1000 ppm by the year 2100. This is modelled using the Representative Concentration Pathway or RCP8.5. The RCPs are pre-decided trajectories of CO2 concentrations, which "tell" a climate model how the CO2 concentration would evolve in the future. The climate model uses this information, does its thing, and then tells us what the future climate would look like, in response to these CO2 concentrations.
 |
| Source |
Or at least that is how it was till the 5th Assessment Report by the IPCC (ah, such simpler times!). For the 6th Report, the IPCC decided to replace the RCP terminology with the SSP terminology. I won't go into detail, since I'm quite tired and I'm sure so are you. But the key thing is that SSPs include the concept of RCPs. They are named as SSPx-y where y refers to the RCPs. So finally, this is what the IPCC projections look like. The last two (SSP5-8.5 and SSP3-7.0) correspond to RCP8.5 and RCP7 trajectories, and show warming of 4-5 degrees by the end of the century. (Which would be quite, quite disastrous, just in case it isn't enormously clear.)
 |
| Source: IPCC AR6 Figure SPM.8 |
To conclude
I hope you're convinced by now how amazing it is that we can reconstruct and model past climates with considerable certainty and detail. Paleoclimate modelling has different uncertainties than future climate modelling. When it comes to the past, it's questions like "How different was the nearest living relative of today's Podocarpus?" which lead to uncertainties. Scientists generally model various different scenarios for this different-ness and come up with estimates along with confidence intervals. But when it comes to the future, it's questions like "How much longer will it take for humankind to get its act together and reduce emissions?" -- and infuriatingly enough, there seems to be no way to answer that with any confidence at all.
===
If you like such posts, you can subscribe here.


Comments
Post a Comment