Yet another ENSO explainer
There are hundreds of ENSO explainers on the internet, so what's the point of another one? This post ─ actually it will be a series of at least 10 posts ─ has two objectives:
(a) To help laypeople (i.e. people with no formal training in climate science) understand the good science communication pieces out there, and
(b) To help journalists discuss ENSO more accurately.
I am not interested in re-writing the same things which have been written about numerous times and satisfactorily before. I'd like to instead direct the reader to these good sources, but in a step-wise and digestible manner.
There are various aspects to ENSO. It is not only one of the most important climate phenomena of our world, but also a tremendously interesting one. My focus here is to relate it to Indian climate, and so I will broadly try to follow this path:
(i) What is ENSO?
(ii) How does it affect Indian climate?
(iii) How will it affect Indian climate in the context of climate change?
= = =
What is ENSO?
The acronym stands for El Niño Southern Oscillation and it describes a climate phenomenon with three phases: El Niño, neutral and La Niña. Precise definitions are not a good starting point, so let's begin with another simpler question first ─ What does ENSO look like? Or put another way, what do the three ENSO phases look like?
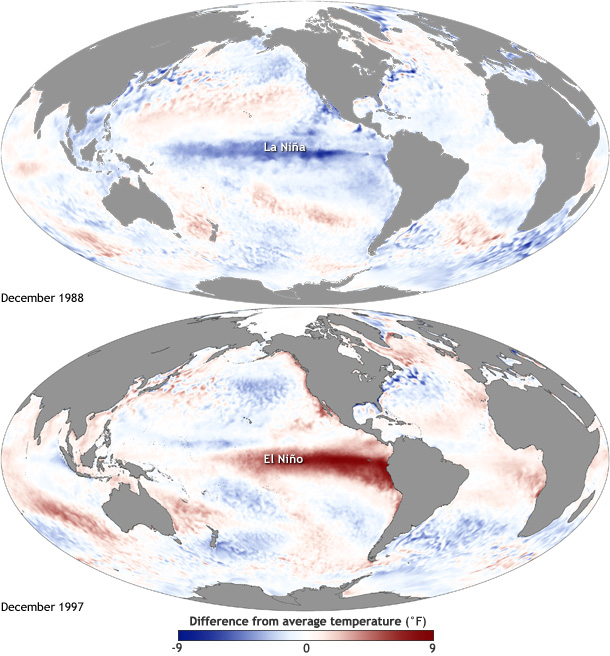
The most straightforward way to understand this is to look at maps of the Pacific Ocean which show sea surface temperature anomalies. The image below shows two specific ENSO events: La Niña of 1988 on the top and El Niño of 1997 on the bottom. The colors show sea surface temperature (SST) anomalies ─ where "sea surface temperature (SST)" simply means that we're looking at the temperature of the sea at the surface and not at some depth. The "anomalies" part is also important ─ it means that instead of looking at absolute values, we're looking at differences relative to the long-term average. In simple words, this means that the equatorial Pacific was cooler-than-average (shown in blue) during the La Niña event of 1988, and it was hotter-than-average (shown in red) during the El Niño event of 1997.
[ This map is from an excellent source of information: the ENSO blog maintained by NOAA scientists. ]
 |
| Source |
To me, this is the first and foremost thing to know about ENSO 一 if it's an El Niño event, the equatorial Pacific is hotter-than-average; if it's a La Niña event, the equatorial Pacific is cooler-than-average; and if the equatorial Pacific looks the same as the average, there are neutral conditions.
Everything else (precipitation, winds, pressure, teleconnections, etc.) comes after.
= = =
For email subscriptions, go here.
Comments
Post a Comment